There has been a significant impact on how Americans spend their discretionary and disposable income after a tumultuous two years.
Discretionary income is the money you remain with after you have met the cost of all essentials, while disposable income is the money you remain with after meeting your tax obligations, according to the Bureau of Economic Analysis.
What Does The Average American Spend Their Money On?
The table below shows the annual spend per person across major categories such as eating out and transport. The table covers three full years and this current year until April. The data allows you to examine the spending habits of Americans across different years in various categories. The source of the data is the Bureau of Economic Analysis.
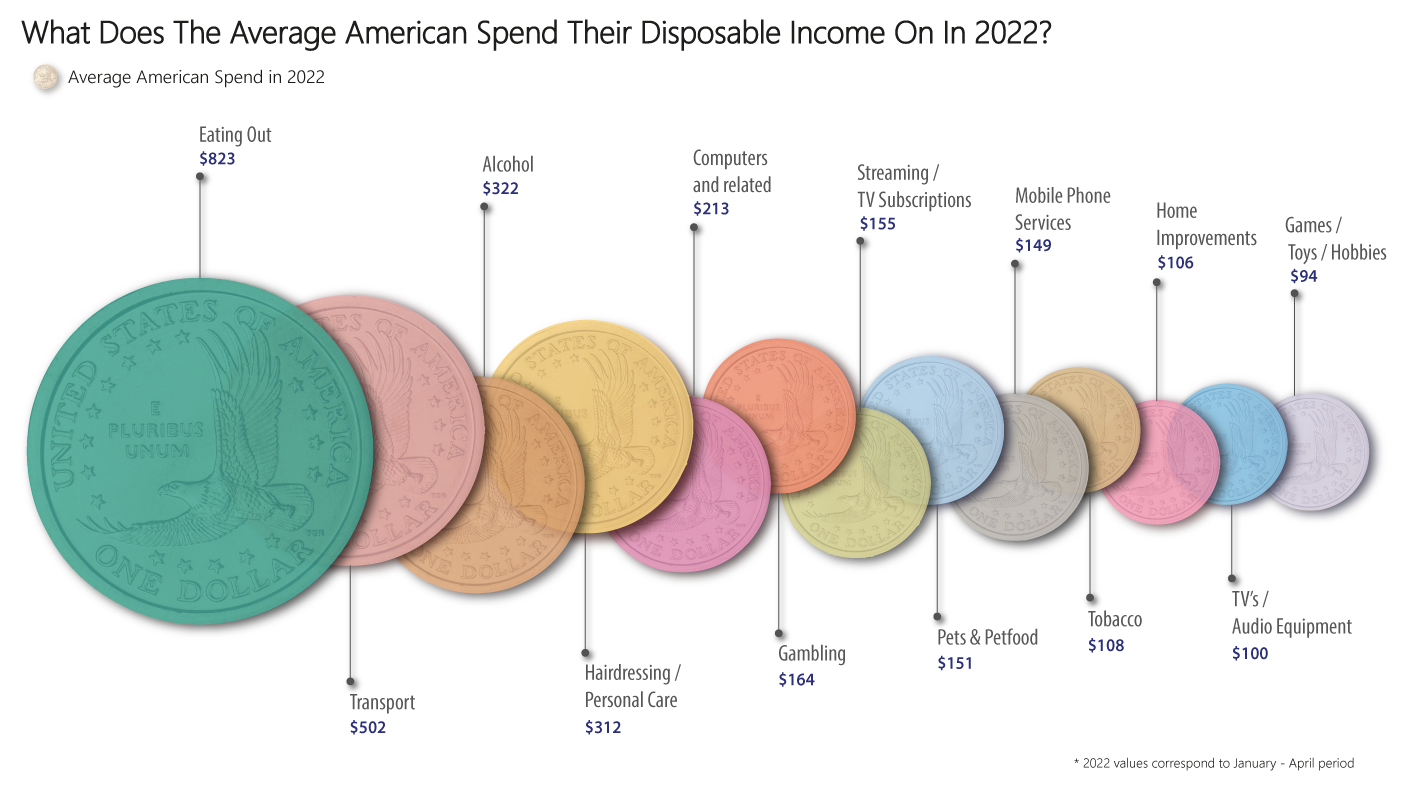
 100vw, 1401px” data-lazy-src=”/?s=news/wp-content/uploads/2022/08/image-3.png”><figcaption id=) Eating out leads the way for Americans and the spending of their disposable income so far in 2022
Eating out leads the way for Americans and the spending of their disposable income so far in 2022Annual Spend Per Person
| Category | 2019 | 2020 | 2021 | 2022 |
| Eating Out | $2,087 | $1,810 | $2,287 | $823 |
| Alcohol | $799 | $788 | $916 | $322 |
| Tobacco | $303 | $313 | $322 | $108 |
| Gambling | $431 | $333 | $455 | $164 |
| Streaming/Subscriptions | $400 | $411 | $442 | £155 |
| TVs/Audio Equipment | $230 | $251 | $296 | $100 |
| Computers & Related | $475 | $534 | $630 | $213 |
| Mobile Phone Services | $403 | $401 | $425 | $149 |
| Games/Toys/Hobbies | $211 | $229 | $274 | $94 |
| Transport | $1,505 | $1,098 | $1,296 | $502 |
| Pets & Pet Food | $359 | $357 | $418 | $151 |
| Home Improvements | $289 | $280 | $302 | £106 |
| Hairdressing & Personal Care | $916 | $725 | $848 | $312 |
| Total | $8,407 | $7,529 | $8,910 | $3,197 |
Average Monthly Breakdown By Year
| Category | 2019 | 2020 | 2021 | 2022 |
| Eating Out | $174 | $151 | $191 | $206 |
| Alcohol | $67 | $66 | $76 | $80 |
| Tobacco | $25 | $26 | $27 | $27 |
| Gambling | $36 | $28 | $38 | $41 |
| Streaming/Subscriptions | $33 | $34 | $37 | $39 |
| TVs/Audio Equipment | $19 | $21 | $25 | $25 |
| Computers & Related | $40 | $44 | $53 | $53 |
| Mobile Phone Services | $34 | $33 | $35 | $37 |
| Games/Toys/Hobbies | $18 | $19 | $23 | $24 |
| Transport | $125 | $92 | $108 | $125 |
| Pets & Pet Food | $30 | $30 | $35 | $38 |
| Home Improvements | $24 | $23 | $25 | $26 |
| Hairdressing & Personal Care | $76 | $60 | $71 | $78 |
| Total | $701 | $627 | $743 | $799 |
The U.S. Population
With the Census Bureau estimating a net gain of one person every 26 seconds, the population of the United States population has a steady growth rate.
California is the most populous state from data collected in 2021. The biggest age group in America is between 20-40 years, which indicates that the country’s population will likely keep growing.
A growing population indicates that expenditure on various goods and services will keep increasing.
But the discretionary or disposable income available to Americans may not increase in line with the population.
Average U.S. Salary
According to the Bureau of Labor Statistics, the average annual U.S. salary is $58,260, an increase from $55,628 in 2020.
An increase in the average yearly salary is a good indicator of an increase in the spending power of Americans.
Eating Out
The cost of eating out fell in 2020 due to Covid-19, and there was a 12.76% decrease in the average annual cost of eating out in 2020 compared to 2019.
The average annual cost of eating out increased by 26.71% in 2021. Ideally, the monthly cost of eating out has continued to grow, as indicated by a 7.98% rise in 2022.
The National Restaurant Association estimated that menu prices increased by 7.7% in the last one year.
Alcohol
A survey by the Massachusetts General Hospital revealed that alcohol consumption increased by 21% by the end of 2020.
This rise correlates with increased expenditure on alcohol by 16.54% and 16.22% in annual and monthly costs, respectively, in 2021.
Tobacco
This is one of the categories that was not adversely affected by Covid-19. Americans’ spending remained consistent in 2020 and 2021 at an average annual cost of $313 and $322, respectively.
The Center for Disease Control and Prevention estimates that approximately 30.8 million Americans smoke.
Gambling
Americans’ spending on gambling declined in 2020. But gambling saw an increase of 37.13% and 36.76% in average annual and monthly costs from 2020 to 2021.
The expenditure on gambling has already increased by 8.15% in average monthly costs in 2022. The American Gaming Association found that the legalization of live betting in 30 states and D.C. is the main reason why spending on gambling has increased.
This expenditure will likely increase as laws legalizing betting in five states are yet to be operational. Legalizing live betting has positively impacted people’s opportunity to place a bet.
Streaming/TV Subscriptions
More Americans are streaming their favorite shows on popular platforms such as Netflix and Amazon Prime.
According to Statista, 62% of American households have subscribed to Netflix, while 54% have subscribed to Amazon Prime.
The popularity of streaming services has grown in line with the monthly cost Americans spent on subscriptions in the past three years.
Televisions/Audio Equipment
The average annual and monthly costs increased by 18.24% and 17.93%, respectively. The National Public Radio found that the time people spent watching television doubled during the pandemic.
This is a key reason why spending on televisions and audio equipment increased.
Computers & Related
The Pew Research Center found that 40% of Americans used computers and other devices as working patterns changed for many.
This explains the increase in spending on computers and other related items from 13.13% and 12.47% in average annual and monthly costs, respectively.
 100vw, 1400px” data-lazy-src=”/?s=news/wp-content/uploads/2022/08/image-1.png”><figcaption id=) Spending habits are gradually moving up to previous levels across all industries in the U.S. as the disposable income of the population increases.
Spending habits are gradually moving up to previous levels across all industries in the U.S. as the disposable income of the population increases.Mobile Phone Services
The disposable income Americans spent on mobile phone services reduced in 2020 to coincide with people staying at home.
A return to normalcy saw the money spent on mobile phone services increase by 6.16% and 5.87% in annual and monthly costs, respectively.
Games/Toys/Hobbies
American spending on games/toys/hobbies increased in 2021 by 20.10% and 19.78% in average annual and average monthly costs, respectively.
The expenditure on games/toys/hobbies in 2022 has increased by 2.95% in average monthly costs.
Transport
Americans’ spending on transport fell drastically in 2020 due to Covid-19. There is a decrease of 26.62% and 27.05% in the annual and monthly transport costs from 2019 to 2020.
The amount of disposable income spent on transport increased by 18.35% and 18.03% for both annual and monthly costs in 2021.
Pets & Pet Food
A survey by the American Society for the Prevention of Cruelty to Animals found that one in five American households acquired a pet.
This explains why the average annual cost of pet and pet food increased by 17.33% in 2021. The average monthly cost increased by 17.02% in 2021 and 8.32% in 2022.
Home Improvements
Americans’ spending on home improvement increased by 8.20% on annual costs in 2021. The average monthly costs have also increased by a slightly smaller margin of 7.91%.
The expenditure on home improvements may be due to the need to increase your home value along with people now working from home and having more free time on their hands before and after the working day to make improvements to their home.
Hairdressing/Personal Care
The annual cost of hairdressing grew by 2.07% in 2020 and 14.35% in 2021 before a huge increase of 103.60% in 2022.
These stats represent a significant increase in disposable income spent on hairdressing or personal care.
The Bureau of Labor Statistics estimates that the wages of hairdressers grew by 1.3%, while the level of employment in the sector grew by 1.6% in 2021.
How Have The Spending Habits Of Americans Changed?
The data above has indicated that the spending habits of Americans were adversely affected by Covid-19 along with the various changes to working patterns and the rising cost of essentials.
The discretionary spending by Americans increased significantly in 2021 and may likely increase for the rest of the year as 2022 draws to a close. This is because the average monthly expenditures in each category in 2022 are higher than in the previous two years.
 100vw, 1401px” data-lazy-src=”/?s=news/wp-content/uploads/2022/08/image-2.png”><figcaption id=) Considerable drops in all spending habits from 2019 to 2022 to correlate with changes in working habits, lifestyle choices and cost of goods
Considerable drops in all spending habits from 2019 to 2022 to correlate with changes in working habits, lifestyle choices and cost of goodsThis trend indicates that Americans already have a higher disposable income in the current year than in the last two years.
Discretionary spending may increase across all categories, but Americans should consider saving or investing some of their discretionary income.